
Vernon - Precipitation
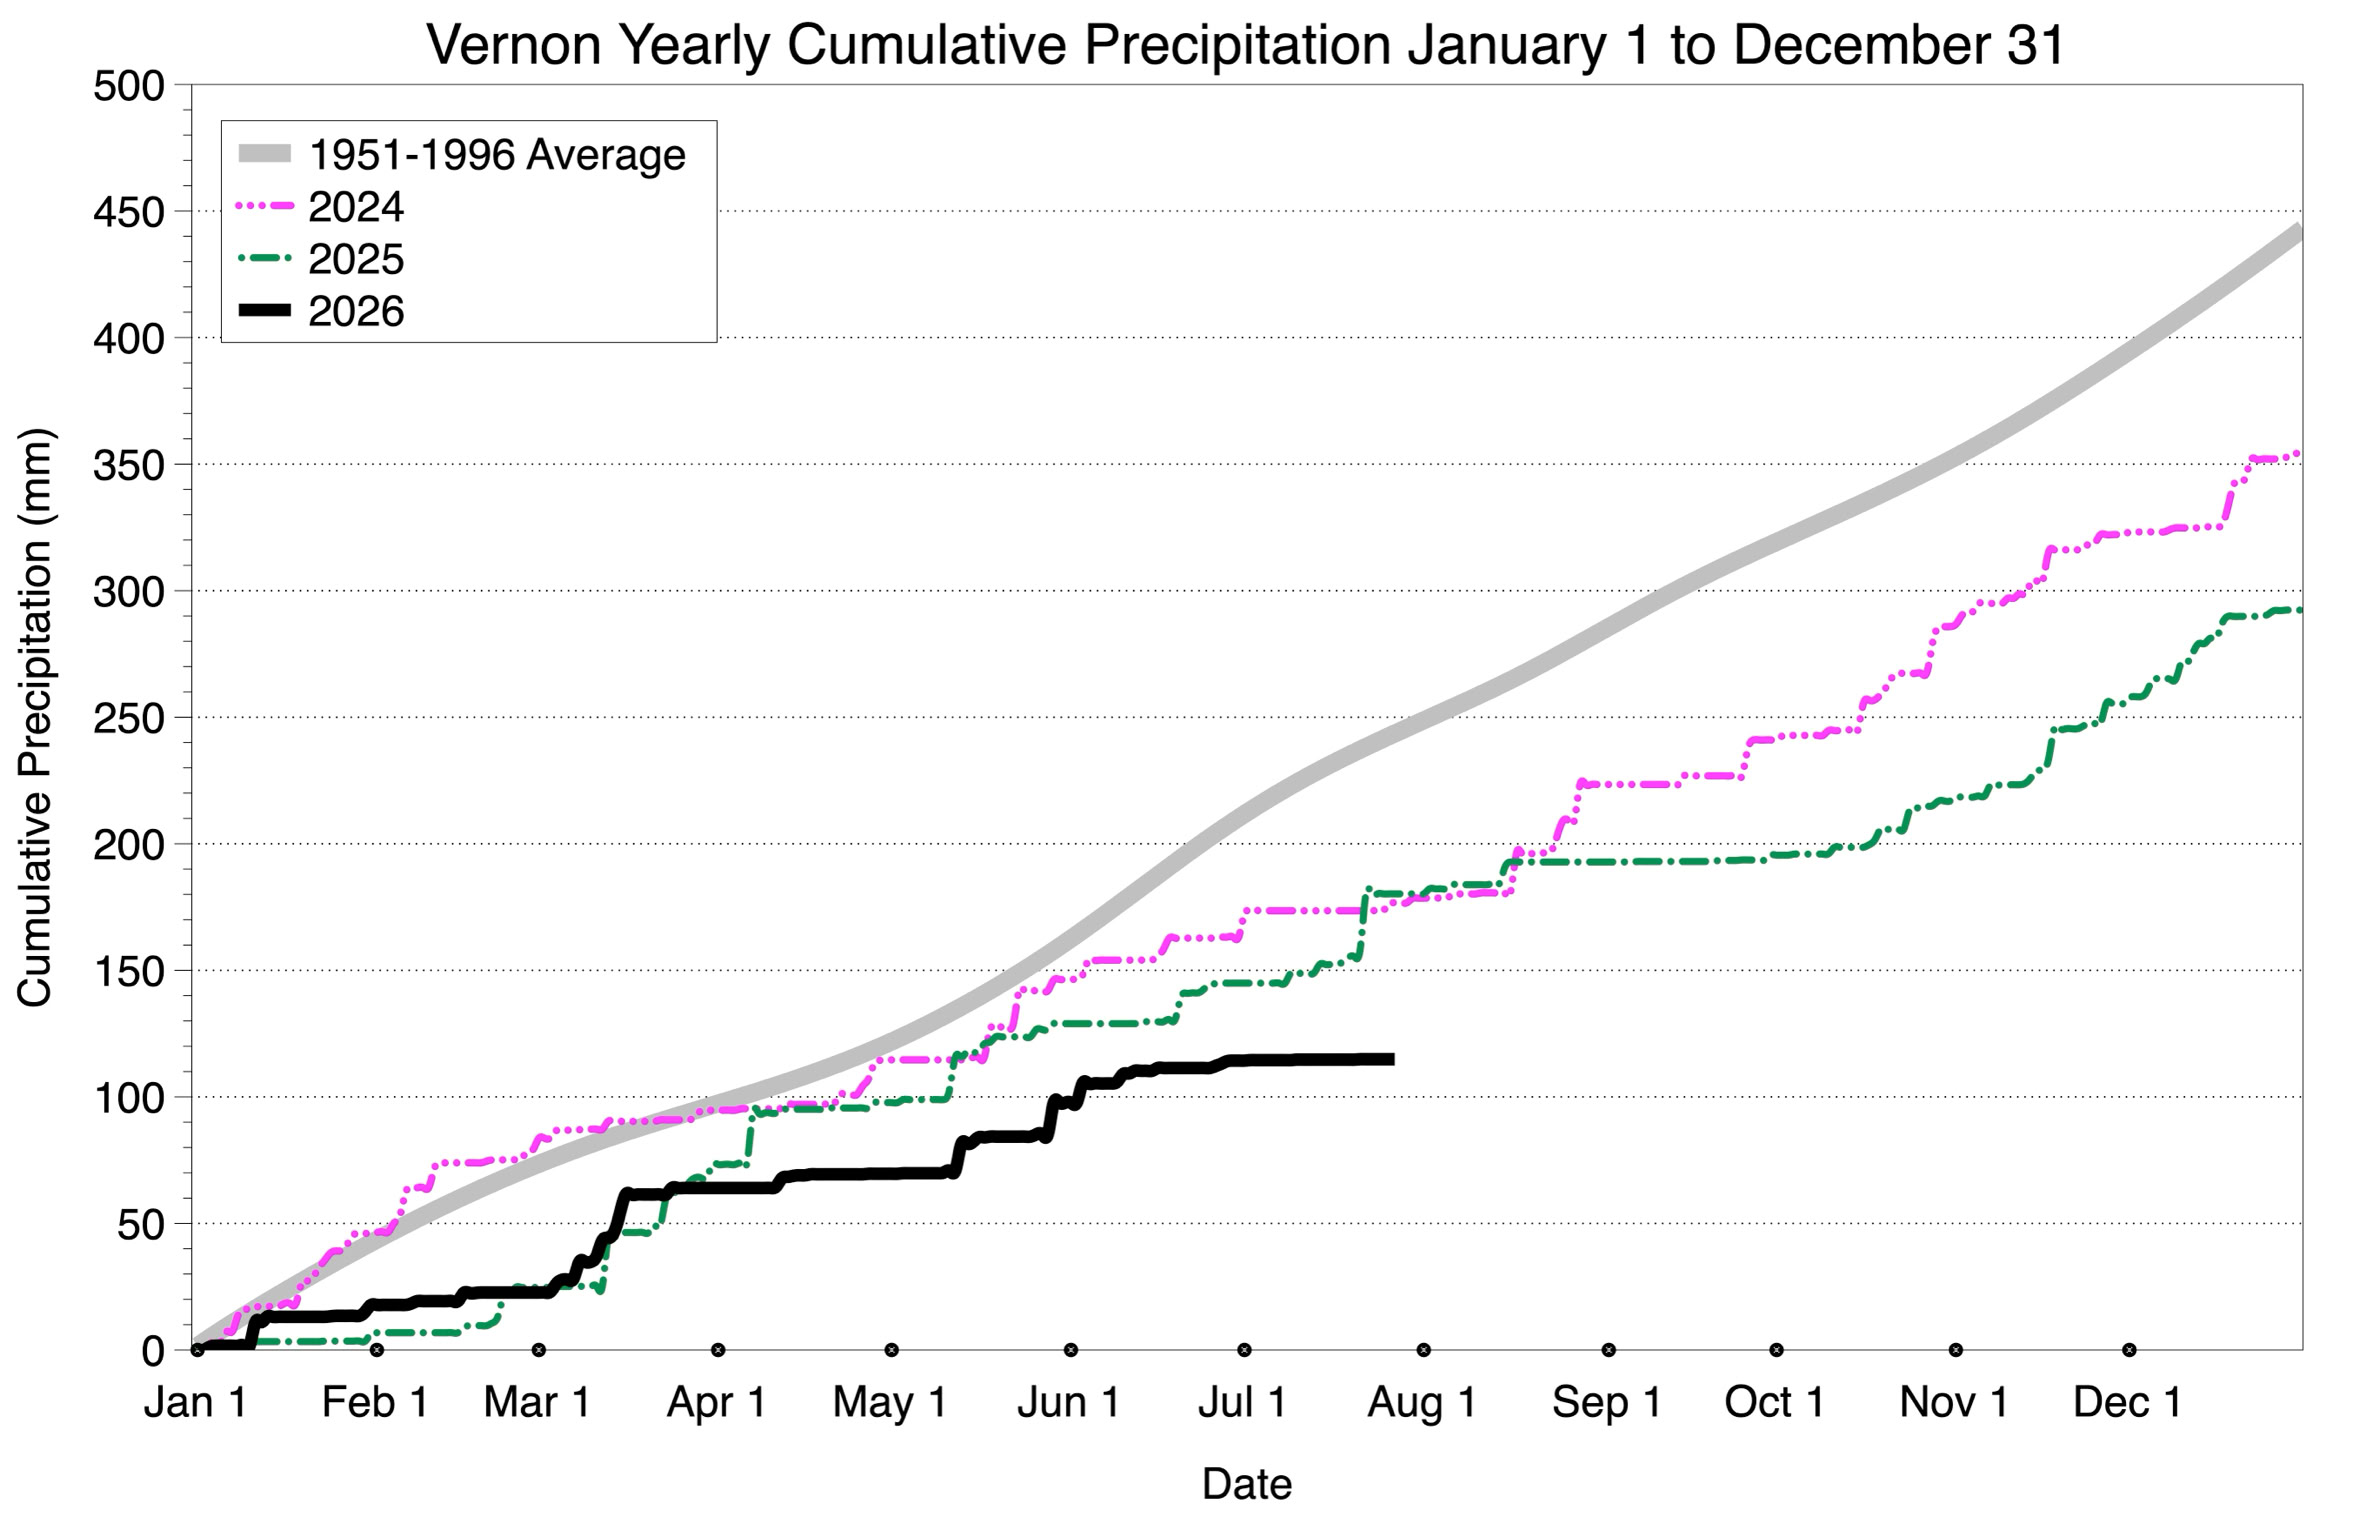
The graph below shows Vernon’s cumulative precipitation from January 1 to December 31. Three years are displayed - 2026, 2025, and 2024. The grey thick line is the average cumulative precipitation calculated from 45 years of data from 1951 to 1996 (minus 1963 because of missing daily observations). Average total cumulative precipitation for 1951 to 1996 by December 31 is 426 mm. As shown, 2026 has a current cumulative precipitation around 47% of the 1951 to 1996 average.
Copyright © 2026 Michael Pidwirny