
Introduction to Human-Caused Climate Change


An examination of climate data from meteorological measurements across our planet's land and ocean areas over the last 125 years reveals obvious patterns of climate change (Figure 1). In Asia, North America, Europe, South America, and Africa, annual temperatures at most meteorological stations were appreciably colder at the beginning of the 20th century. From the 1920s to the 1950s, temperatures became warmer. Colder temperatures returned in the 1960s and persisted until the mid-seventies. A warming trend followed these cooler years and has continued ever since, with nine of the warmest years in the 20th and 21st centuries being recorded in the last 10 years. Figure 2 describes the warming trends observed in the first quarter of the 21st century across Asia, North America, Europe, South America, and Africa.
Over extended periods, non-instrumental climate data also indicate that weather has been quite variable in North America and worldwide. For example, over the past 800,000 years, there have been several great ice ages during which 30% of the Earth's continental surface was covered by glacial ice several kilometers (miles) thick. Each glacial period lasted about 100,000 years and was followed by a warmer interglacial period persisting for roughly 10,000 to 12,500 years.
For the past 10,000 years, the Earth has enjoyed the warm temperatures of the latest interglacial period. During this period, the Earth's average global temperature fluctuated by about 2°C (3.6°F) over short periods (less than 500 years). These moderate, relatively slow fluctuations in climate have not led to drastic changes in Earth's environment. Today's annual mean global temperature is about 15°C (59°F).
So, what factors are responsible for the temperature fluctuations just described? Scientists suggest that changes in the Earth's climate can be the result of the following factors:
Global Climate Change 1880 to 2025
The period from 1880 to the present has been marked by progressive warming. Figure 3 describes the annual mean global surface temperatures from 1880 to 2025. This graph shows these yearly temperatures relative to the average global temperature calculated for 30 years from 1951 to 1980 (14.0°C). As shown on the graph, the first 60 years of the record were below 14.0°C. Beginning in the late 1970s, temperatures above 14.0°C became common, and from 2000 to 2025, temperatures were 0.4 to 1.0°C (0.7 to 1.8°F) higher than the average from 1951 to 1980.
From 1910 to about 1945, the mean global surface temperature increased from 13.6 to 14.2°C or about 0.60°C (1.08°F). Some scientists during this period suggested that the increase may be due to rising levels of atmospheric carbon dioxide (CO2) and an enhanced greenhouse effect. In response to these concerns, scientist David Keeling established the first continuous CO2 monitoring station on the summit of Mauna Loa in Hawaii. After a few years of measurement, a rising year-to-year signal was quite apparent. In the 1930s and 1950s, the Central United States experienced two extended periods of extreme drought.
From 1945 to 1970, global temperatures rose by 0.2°C (0.35°F) and remained somewhat constant around the 1951 to 1980 average. This trend led to a decline in interest in global warming research. A few scientists even believed that the observed cooling could be the beginning of the next ice age. After this period of cooling, the planet's warming returned, with even greater intensity starting in the 1970s. By the 1990s, many scientists suggested that increasing atmospheric concentrations of carbon dioxide, methane, and nitrous oxide were primarily responsible for this global warming trend. Measurements from 1951 to 2025 suggest that much of the year-to-year variability in global mean surface temperatures was correlated with El Niño and La Niña events (Figure 4). El Niños tend to warm the planet for a year or two, while La Niña events cause temporary cooling.
Now in the middle of the third decade of the 21st century, global temperatures are about 1.5°C (2.7°F) higher than at the start of the 20th century. According to global mean annual temperature measurements, in the ten years between 2016 and 2025, we had nine of the warmest years in the 20th and 21st centuries and possibly since the Medieval Warm Period (Figure 3). Most climate scientists now conclude that the warmer temperatures of the 20th and 21st centuries are undoubtedly the result of a human-altered greenhouse effect.


Figure 4 Global mean annual temperature anomalies for the period 1950-2025. Each yearly anomaly was calculated relative to the 1951 to 1980 average. This graph also shows whether the year was an El Niño or La Niña event. Image Copyright: Michael Pidwirny, Data Source: . http://data.giss.nasa.gov/gistemp/graphs_v4/.

Figure 3 Global annual mean surface temperature measurements from 1880 to 2025 using NASA’s Goddard Institute for Space Studies (GISS) dataset. The red dashed line is the average surface temperature from 1951 to 1980 (14°C). Image Copyright: Michael Pidwirny, Data Source: http://data.giss.nasa.gov/gistemp/graphs_v4/.
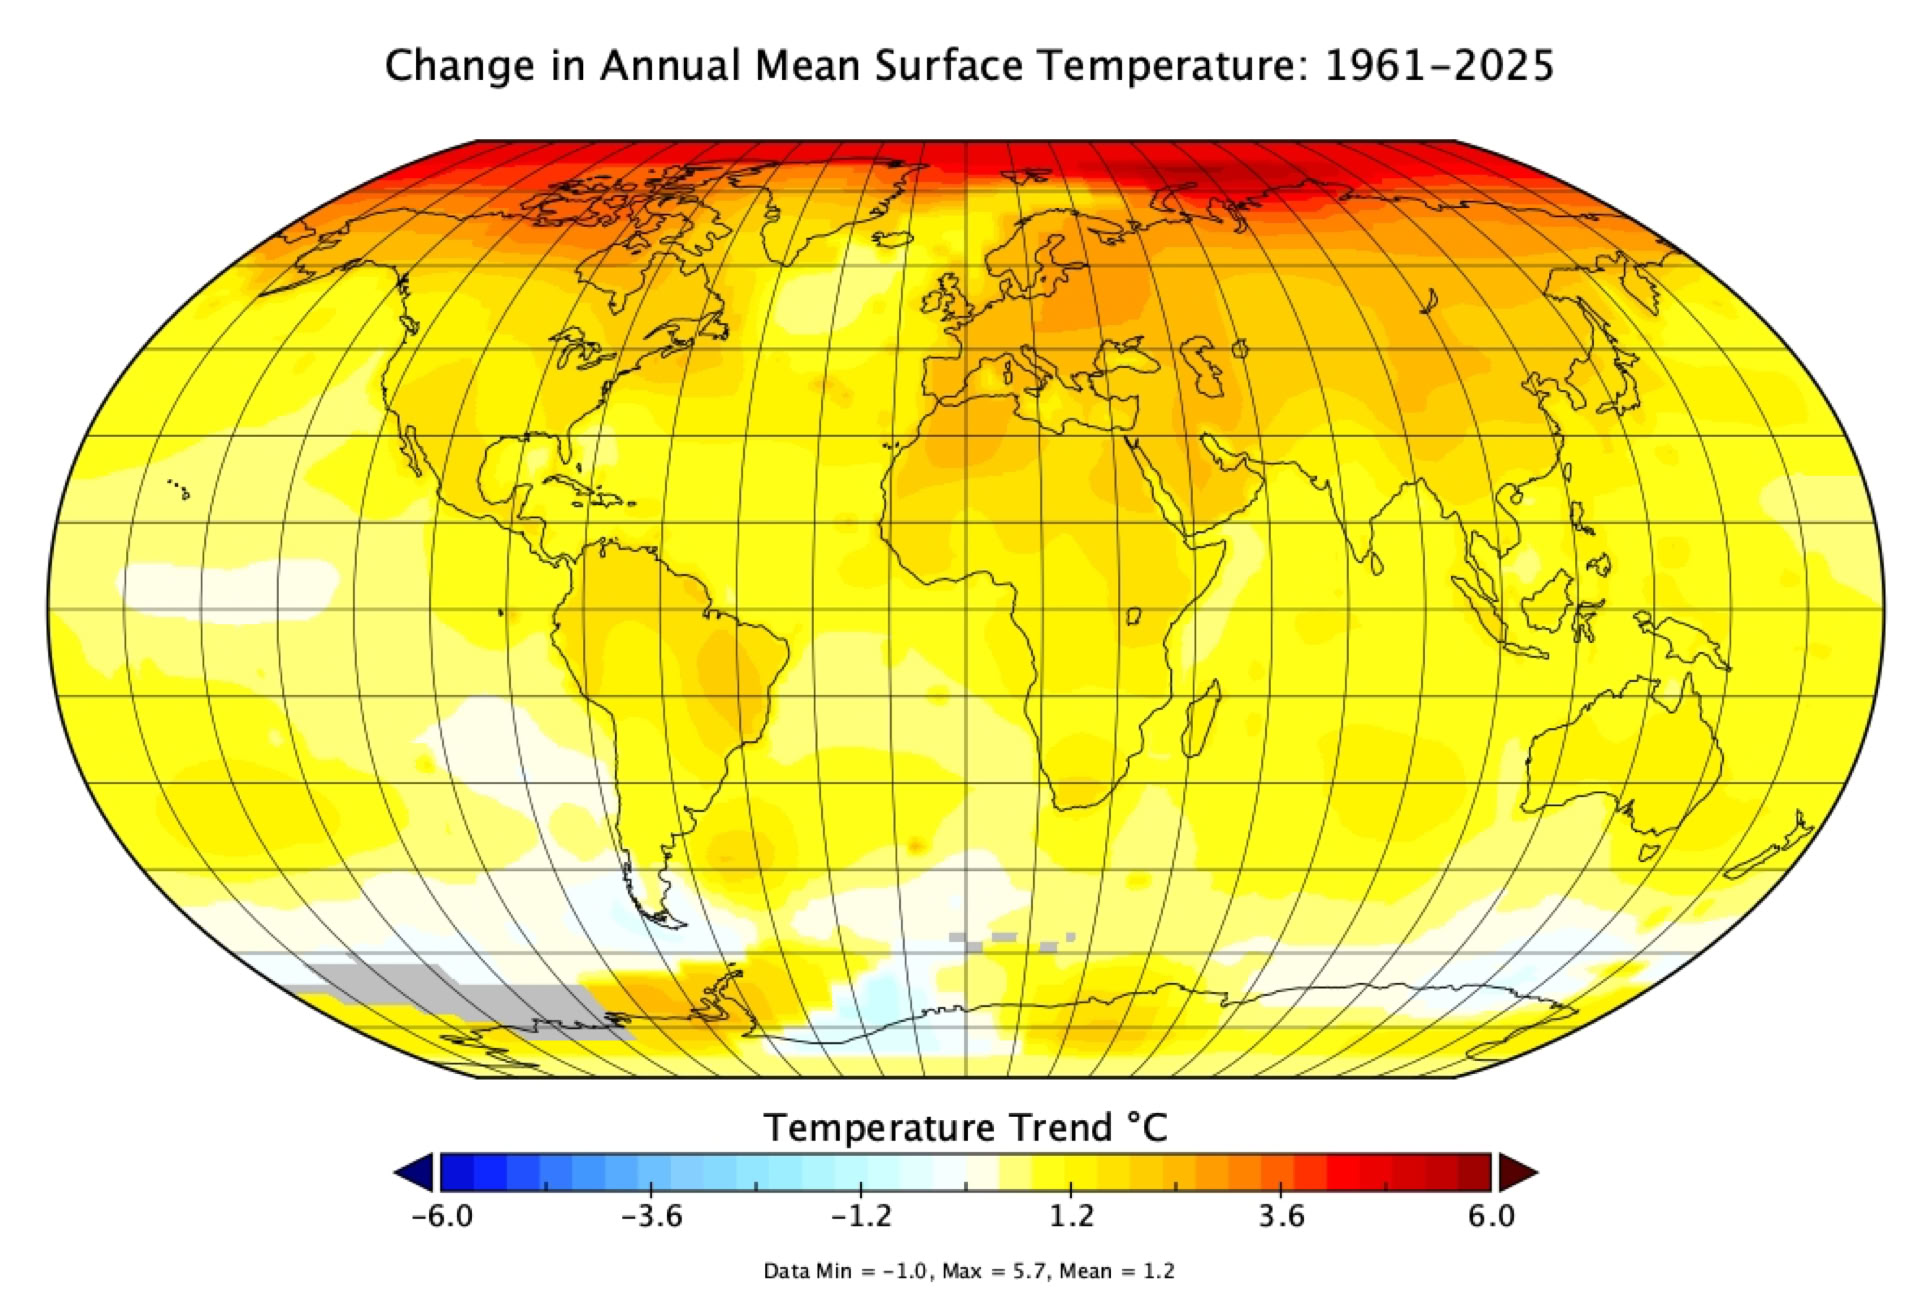
Figure 1 Historical change in annual mean surface temperatures for the periods 1901 to 1960 (60 years) and 1961 to 2025 (65 years). Note that these two periods are roughly the same length. The difference in global warming between the two images shows that the rate of increase in surface temperatures over land and ocean is much greater after 1961. Areas in grey have insufficient data. Image Copyright: Michael Pidwirny. Date Source: NASA - Goddard Institute for Space Studies - Surface Temperature Analysis. Land Data from GISS Surface Temperature Analysis V4, Ocean Data from NOAA/NCEI's Extended Reconstructed Sea Surface Temperature V5.
Figure 2 Regional changes in surface annual mean temperature (°C) for the first quarter of the 21st century (2001-2025) relative to the 1951 to 1980 average. Regions shown are Asia, North America, Europe, South America, and Africa. Image Creation and Source: Climate ReAnalyzer - Monthly Reanalysis Maps.
Copyright © 2026 Michael Pidwirny