
Penticton - Future Climate
Forecasts of Penticton’s future near surface air temperatures and precipitation were made using a stochastic weather simulator called LARS-WG version 8.0. This software uses site-specific historical daily weather measurements to make future predictions. In this case, I selected 30 years of daily measurements from 1991 to 2020. From this historical data, probability distributions were computed by the software that capture the observed variability and extremes in historical air temperature and precipitation. This software can then intergrate these calculated probability distributions with the outputs of up to fifteen Global Climate Models from the Coupled Model Intercomparison Project Phase 6 (CMIP6) to generate daily-scale future forecasts. A subset of eight climate models was selected whose output was averaged to produce a single forecast with an Equilibrium Climate Sensitivity of 3.2°C. This approach is called climate ensemble modeling. The names, country of origin, and the Equilibium Climate Sensitivity of these eight models are described in Table 1.
Three different future greenhouse gas emission scenarios were considered: SSP1-2.6, SSP2-4.5, and SSP5-8.5 (see Forecasting Human-Caused Climate Change page and the following Wikipedia Link for more information on emission scenarios used for climate modeling). Finally, the predictions were made for the following times in the future: 2030 (2021-2040), 2050 (2041-2060), 2070 (2061-2080), and 2090 (2081-2100).
Annual Changes
Shown in Figure 1 is the annual average mean temperature future forecast from 2030 to 2090 relative to the historical data. The emission scenarios SSP1-2.6, SSP2-4.5, and SSP5-8.5 forecast that annual average mean temperature will increase, respectively, to 11.8, 12.9, and 14.8°C by 2090. According to the best-fit line through the historical data, annual average mean temperature was estimated to be 10.0°C in 2025 and 8.6°C in 1951.
Figure 2 shows annual precipitation future forecast from 2030 to 2090 relative to the historical data. The emission scenarios SSP1-2.6, SSP2-4.5, and SSP5-8.5 forecast that annual precipitation will increase, respectively, to 394, 391, and 399 mm by 2090. According to historical data, annual precipitation averaged 319 mm from 1951-2025.
Seasonal Changes
Shown in Figure 3 is the spring (March, April, and May) average mean temperature future forecast from 2030 to 2090 relative to the historical data. The emission scenarios SSP1-2.6, SSP2-4.5, and SSP5-8.5 forecast that spring average mean temperature will increase, respectively, to 11.3, 12.2, and 13.9°C by 2090. According to the best-fit line through the historical data, spring average mean temperature was estimated to be 9.8°C in 2025 and 8.4°C in 1951.
Figure 4 describes the summer (June, July, and August) average mean temperature future forecast from 2030 to 2090 relative to the historical data. The emission scenarios SSP1-2.6, SSP2-4.5, and SSP5-8.5 forecast that summer average mean temperature will increase, respectively, to 21.9, 22.9, and 25.0°C by 2090. According to the best-fit line through the historical data, summer average mean temperature was estimated to be 20.6°C in 2025 and 18.5°C in 1951.
Figure 5 displays the fall (September, October, and November) average mean temperature future forecast from 2030 to 2090 relative to the historical data. The emission scenarios SSP1-2.6, SSP2-4.5, and SSP5-8.5 forecast that fall average mean temperature will increase, respectively, to 11.7, 13.0, and 15.2°C by 2090. According to the best-fit line through the historical data, fall average mean temperature was estimated to be 9.6°C in 2025 and 8.5°C in 1951.
Figure 6 shows the winter (previous year December, January, and February) average mean temperature future forecast from 2030 to 2090 relative to the historical data. The emission scenarios SSP1-2.6, SSP2-4.5, and SSP5-8.5 forecast that winter average mean temperature will increase, respectively, to 2.1, 3.3, and 4.9°C by 2090. According to the best-fit line through the historical data, winter average mean temperature was estimated to be 0.0°C in 2026 and -0.9°C in 1952.
Monthly Changes
Figure 7 shows the future change in average monthly minimum temperatures from the historical 50-year average 1951-2000 to 2090 for the greenhouse gas emission scenarios SSP2-4.5 and SSP5-8.5. All months increase significantly in temperature by 2090 relative to 1951-2000, ranging from 3.0 to 4.5°C for the SSP2-4.5 emission scenario. For the SSP5-8.5 emission scenario, the increase was between 4.5 to 6.9°C relative to the 1951-2000 average. The greatest rise in temperature for both emission scenarios occurred in the late summer, fall and winter months.
Figure 8 illustrates the future change in average monthly maximum temperatures from the historical 50-year average 1951-2000 to 2090 for the greenhouse gas emission scenarios SSP2-4.5 and SSP5-8.5. All months increase significantly in temperature by 2090 relative to 1951-2000, ranging from 2.9 to 4.8°C for the SSP2-4.5 emission scenario. For the SSP5-8.5 emission scenario, the increase was between 4.5 to 7.4°C relative to the 1951-2000 average. The greatest rise in temperature for both emission scenarios occurred in the late summer, fall and early winter months.
Days Greater Than 30°C
Figure 9 shows the annual number of days with a maximum temperature greater than (>) 30°C future forecast from 2030 to 2090 relative to the historical data. The emission scenarios SSP1-2.6, SSP2-4.5, and SSP5-8.5 forecast that the number of days with a maximum temperature greater than (>) 30°C will increase, respectively, to 46, 58, and 76 days per year by 2090. According to the best-fit line through the historical data, the annual number of days with a maximum temperature greater than (>) 30°C was estimated to be 35 days in 2025 and 21 days in 1951.
Days Less Than 0°C
Figure 10 describes the annual number of days with a minimum temperature less than (<) 0°C future forecast from 2030 to 2090 relative to the historical data. The emission scenarios SSP1-2.6, SSP2-4.5, and SSP5-8.5 forecast that the number of days with a minimum temperature less than (<) 0°C will decrease, respectively, to 72, 55, and 35 days per year by 2090. According to the best-fit line through the historical data, the annual number of days with a minimum temperature less than (<) 0°C was estimated to be 107 days in 2025 and 118 days in 1951.
Additional References
1) Climate Projections for the Okanagan Region - Regional District of Okanagan-Similkameen
2) Climate Resilient Kelowna Strategy - September 2024
3) White, R.H., Anderson, S., Booth, J.F., Braich, G., Draeger, G., Fei, C., Harley, C.D.G., Henderson, S.B. , Jakob, M., Lau, C.-A., Admasu, L.M., Narinesing, V., Rodell, C., Roocroft, E., Weinberger, K.R., & West, G. 2023. The unprecedented Pacific Northwest heatwave of June 2021. Nature Communications, 14, 727. https://doi.org/10.1038/s41467-023-36289-3
Table 1 Global climate models used to forecast future near surface air temperatures and precipitation for Penticton.
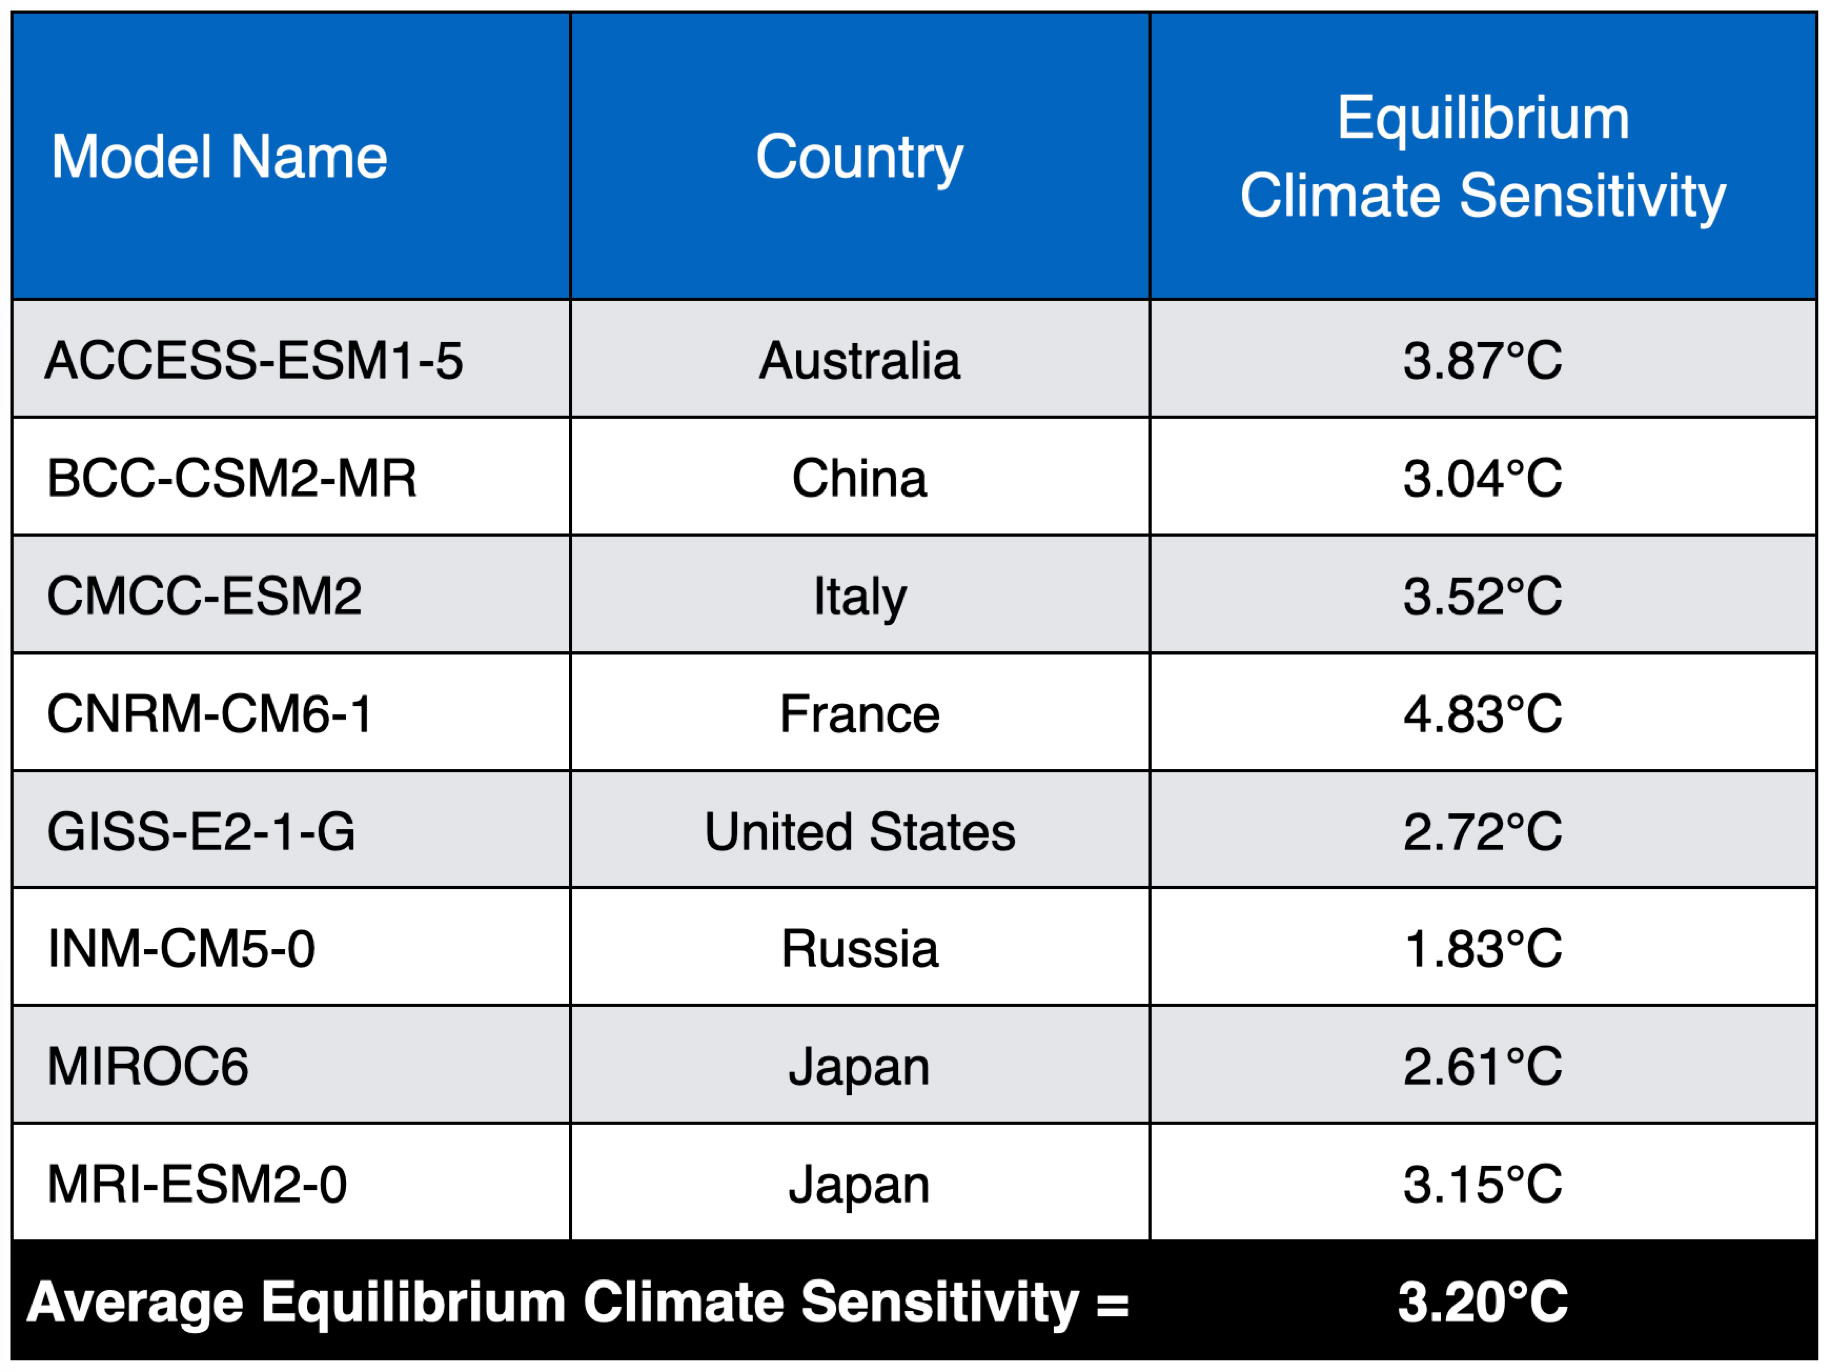
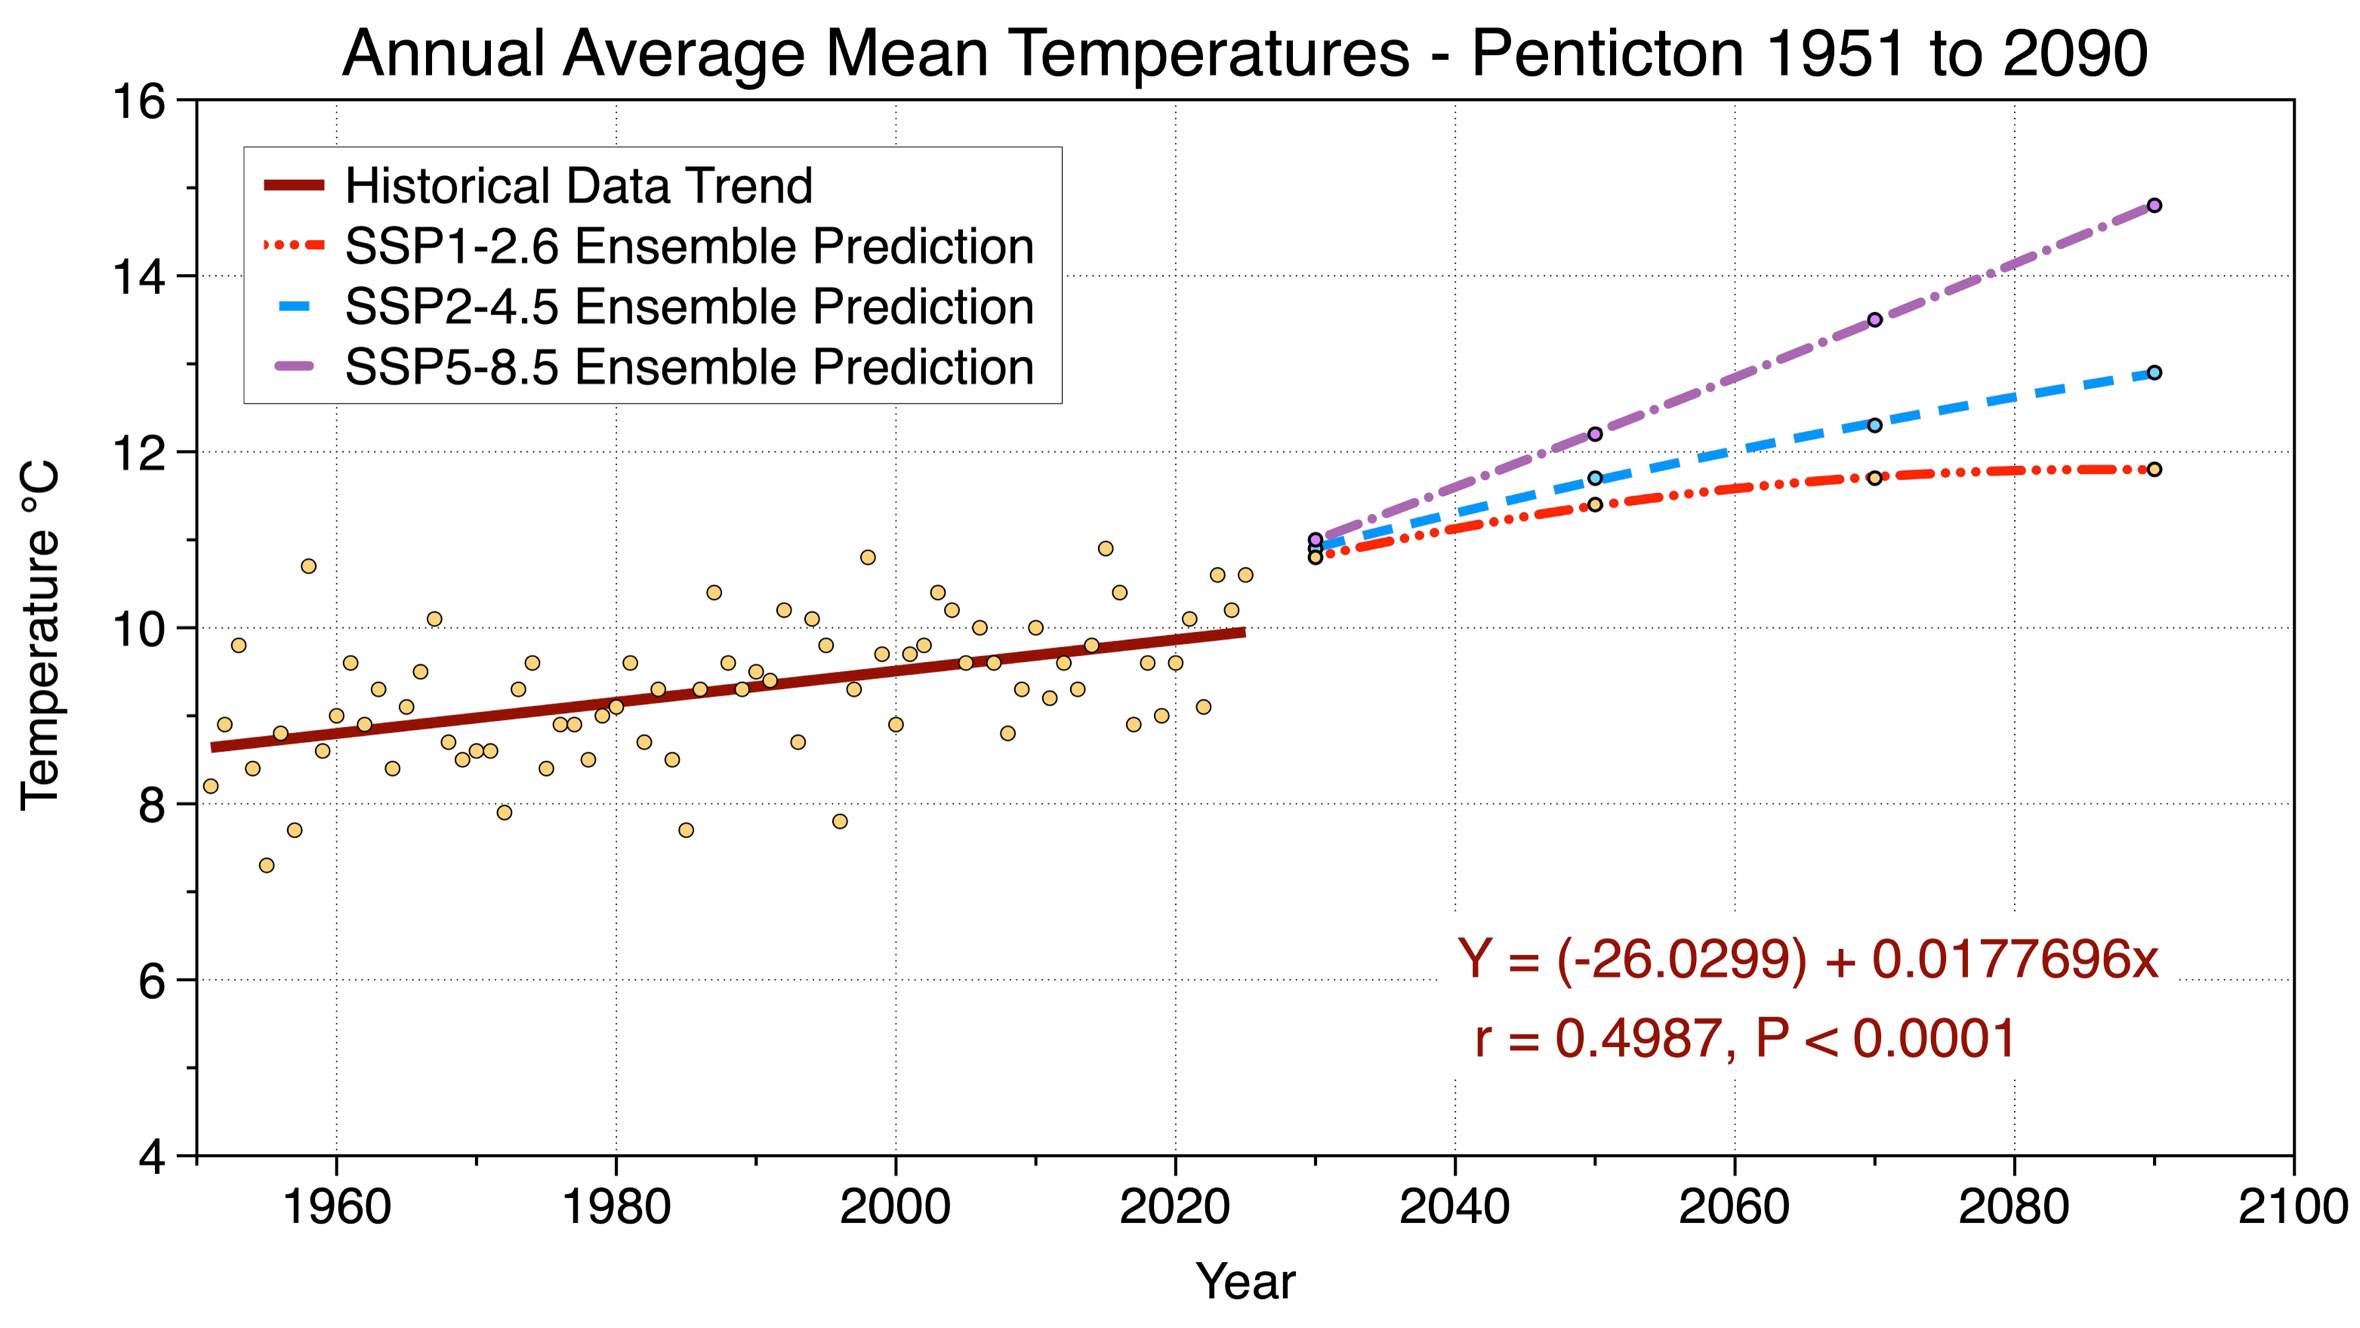
Figure 1 Eight-model ensemble forecasted changes in Penticton’s annual average mean temperature under SSP1-2.6, SSP2-4.5, and SSP5-8.5 emission scenarios from 2030 to 2090. Also shown is the historical measurements of annual average mean temperature from 1951-2025, and a best-fit linear regression line (brown colored) describing the average change in this climate variable during this period.


Figure 3 Eight-model ensemble forecasted changes in Penticton’s spring average mean temperature under SSP1-2.6, SSP2-4.5, and SSP5-8.5 emission scenarios from 2030 to 2090. Also shown is the historical measurements of spring average mean temperature from 1951-2025, and a best-fit linear regression line (teal colored) describing the average change in this climate variable during this period.

Figure 4 Eight-model ensemble forecasted changes in Penticton’s summer average mean temperature under SSP1-2.6, SSP2-4.5, and SSP5-8.5 emission scenarios from 2030 to 2090. Also shown is the historical measurements of summer average mean temperature from 1951-2025, and a best-fit linear regression line (teal colored) describing the average change in this climate variable during this period.
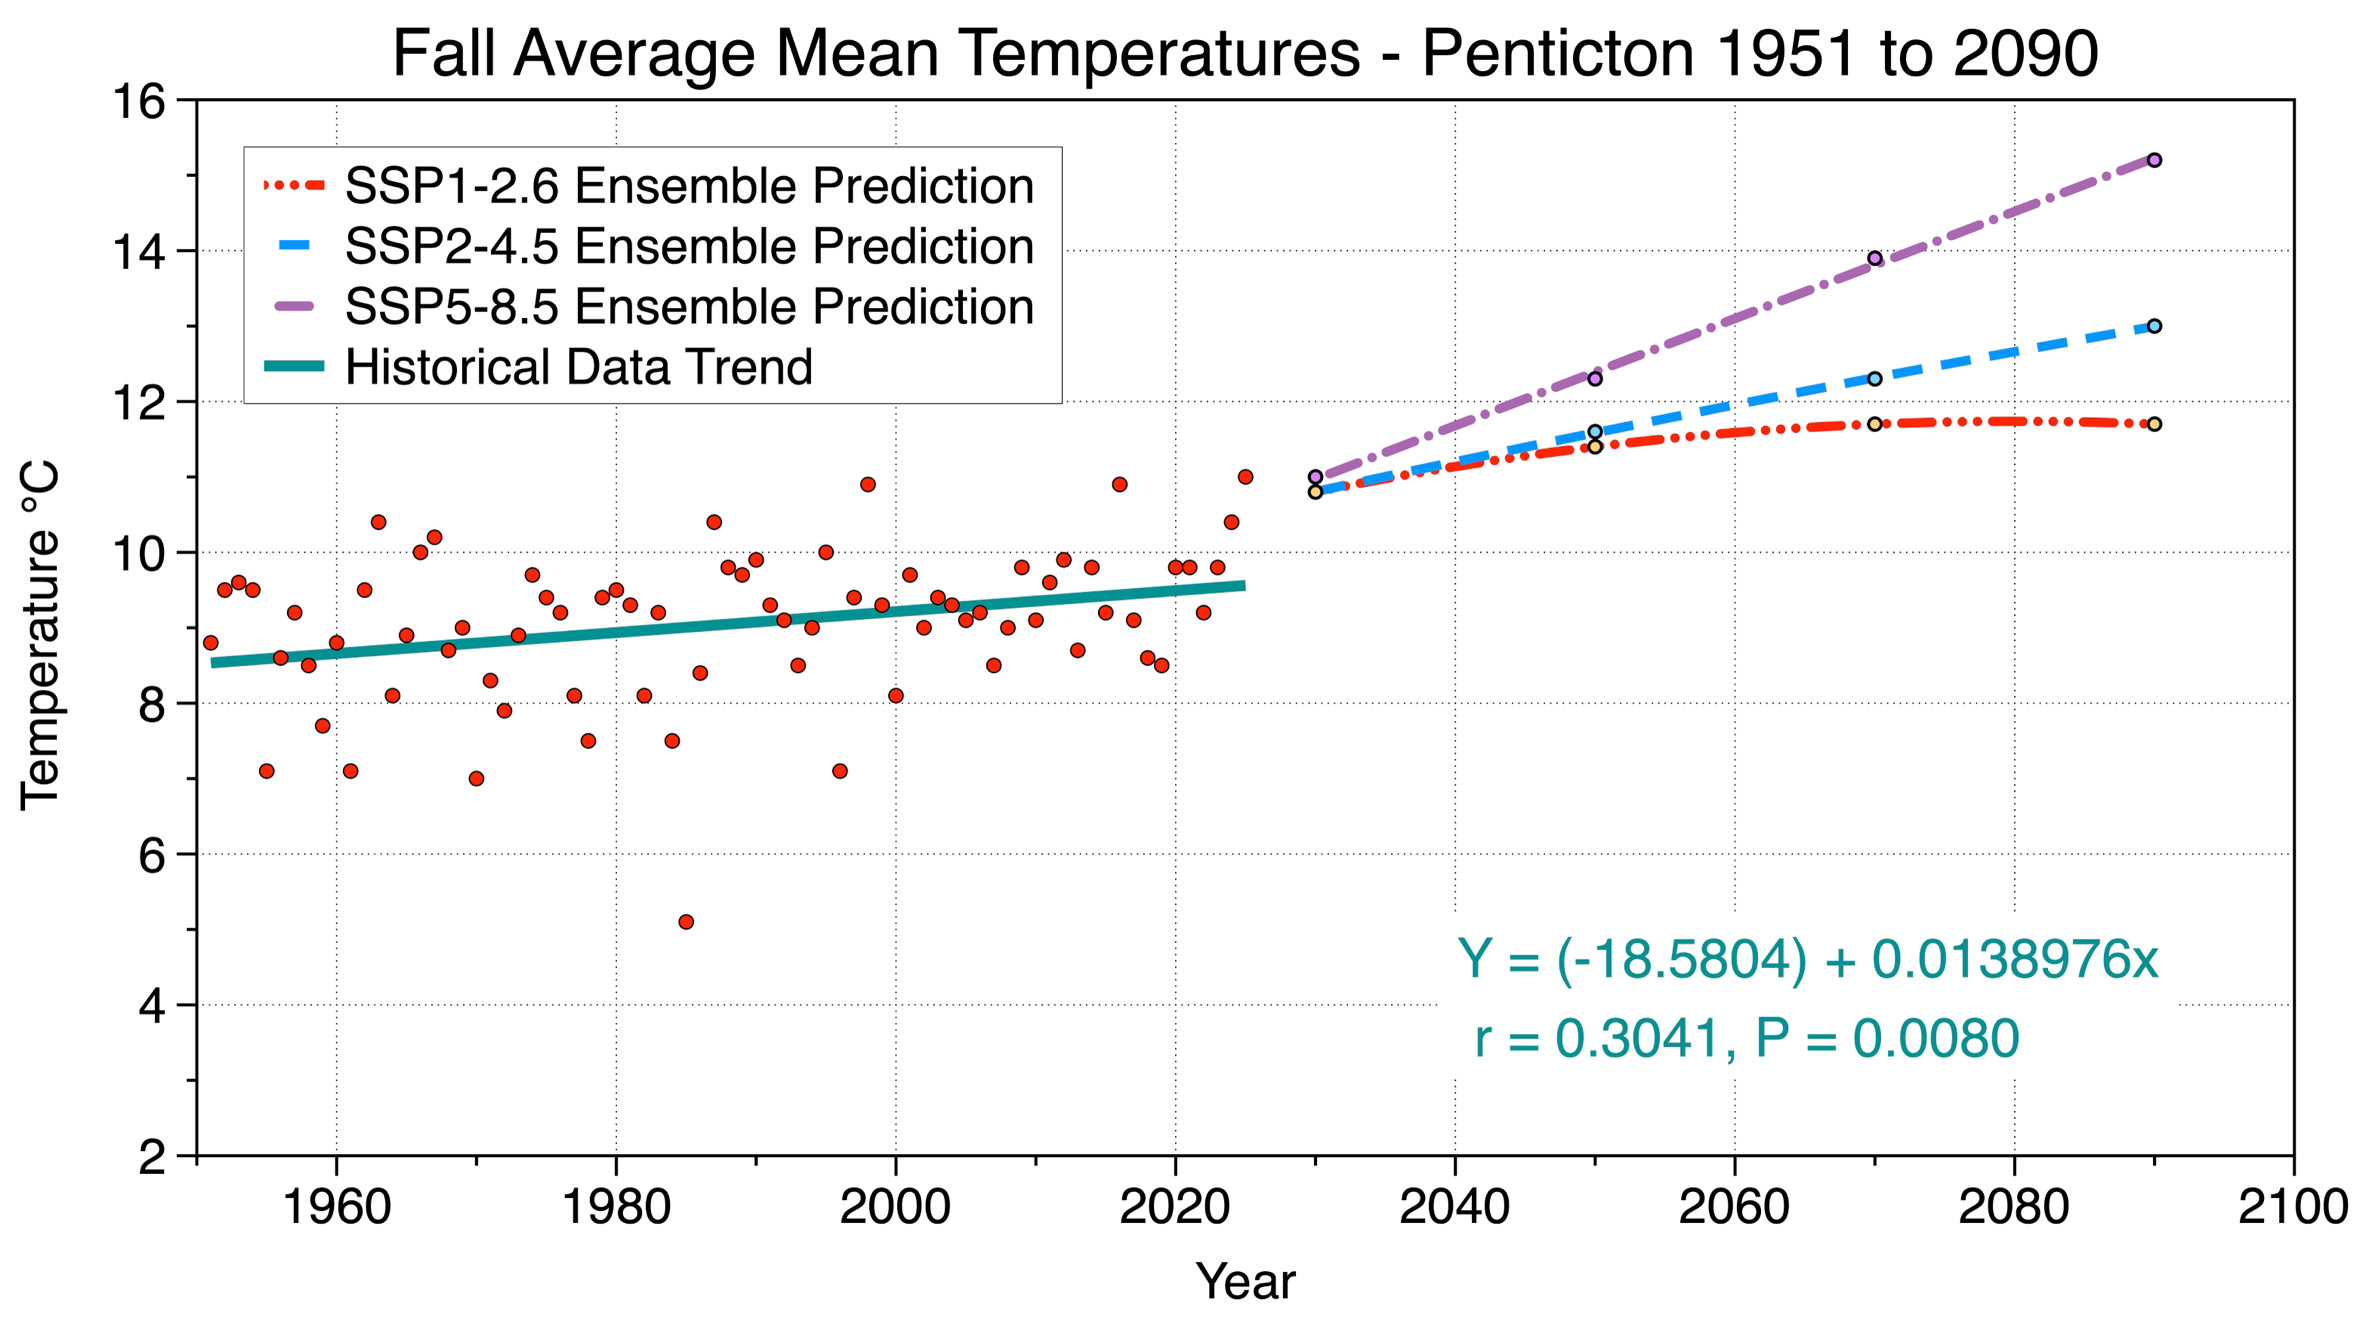
Figure 5 Eight-model ensemble forecasted changes in Penticton’s fall average mean temperature under SSP1-2.6, SSP2-4.5, and SSP5-8.5 emission scenarios from 2030 to 2090. Also shown is the historical measurements of fall average mean temperature from 1951-2025, and a best-fit linear regression line (teal colored) describing the average change in this climate variable during this period.
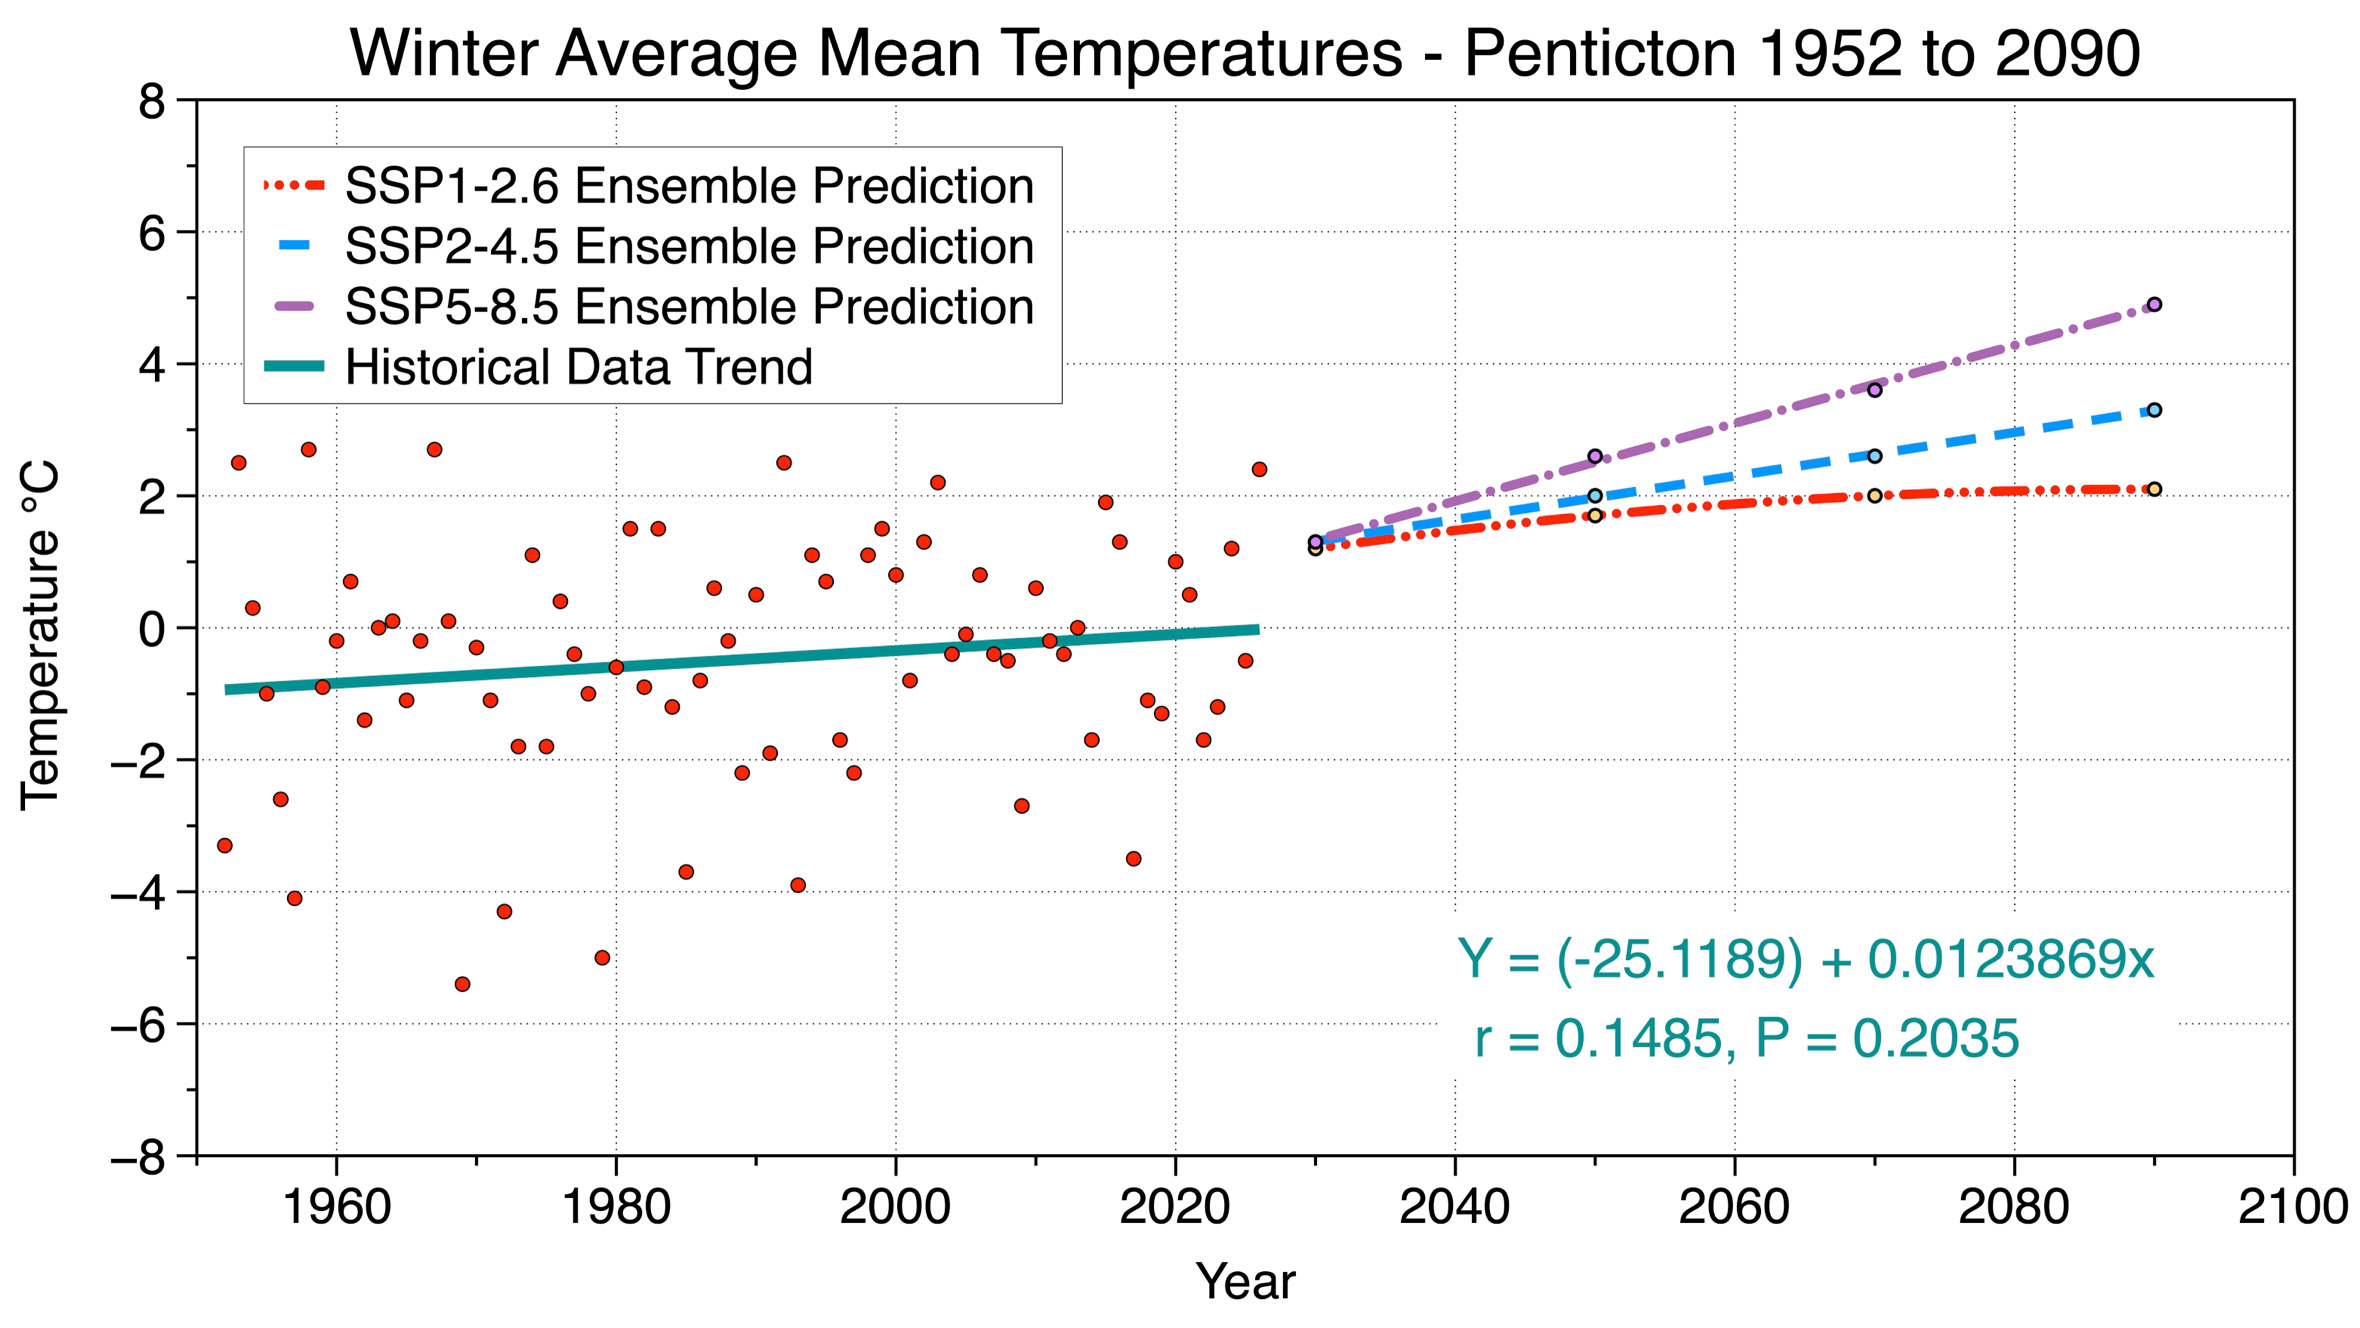
Figure 6 Eight-model ensemble forecasted changes in Penticton’s winter average mean temperature under SSP1-2.6, SSP2-4.5, and SSP5-8.5 emission scenarios from 2030 to 2090. Also shown is the historical measurements of winter average mean temperature from 1952 to 2026, and a best-fit linear regression line (teal colored) describing the average change in this climate variable during this period.

Figure 7 Future change in average monthly minimum temperatures at Penticton from 1951-2000 to 2090 for the SSP2-4.5 and SSP5-8.5 greenhouse gas emission scenarios.

Figure 8 Future change in average monthly maximum temperatures at Penticton from 1951-2000 to 2090 for the SSP2-4.5 and SSP5-8.5 greenhouse gas emission scenarios.

Figure 9 Eight-model ensemble forecasted changes in Penticton’s annual number of days with a maximum temperature greater than (>) 30°C under SSP1-2.6, SSP2-4.5, and SSP5-8.5 emission scenarios from 2030 to 2090. Also shown is the historical measurements of the annual number of days with a maximum temperature greater than (>) 30°C from 1951-2025, and a best-fit linear regression line (green line) describing the average change in this climate variable during this period.
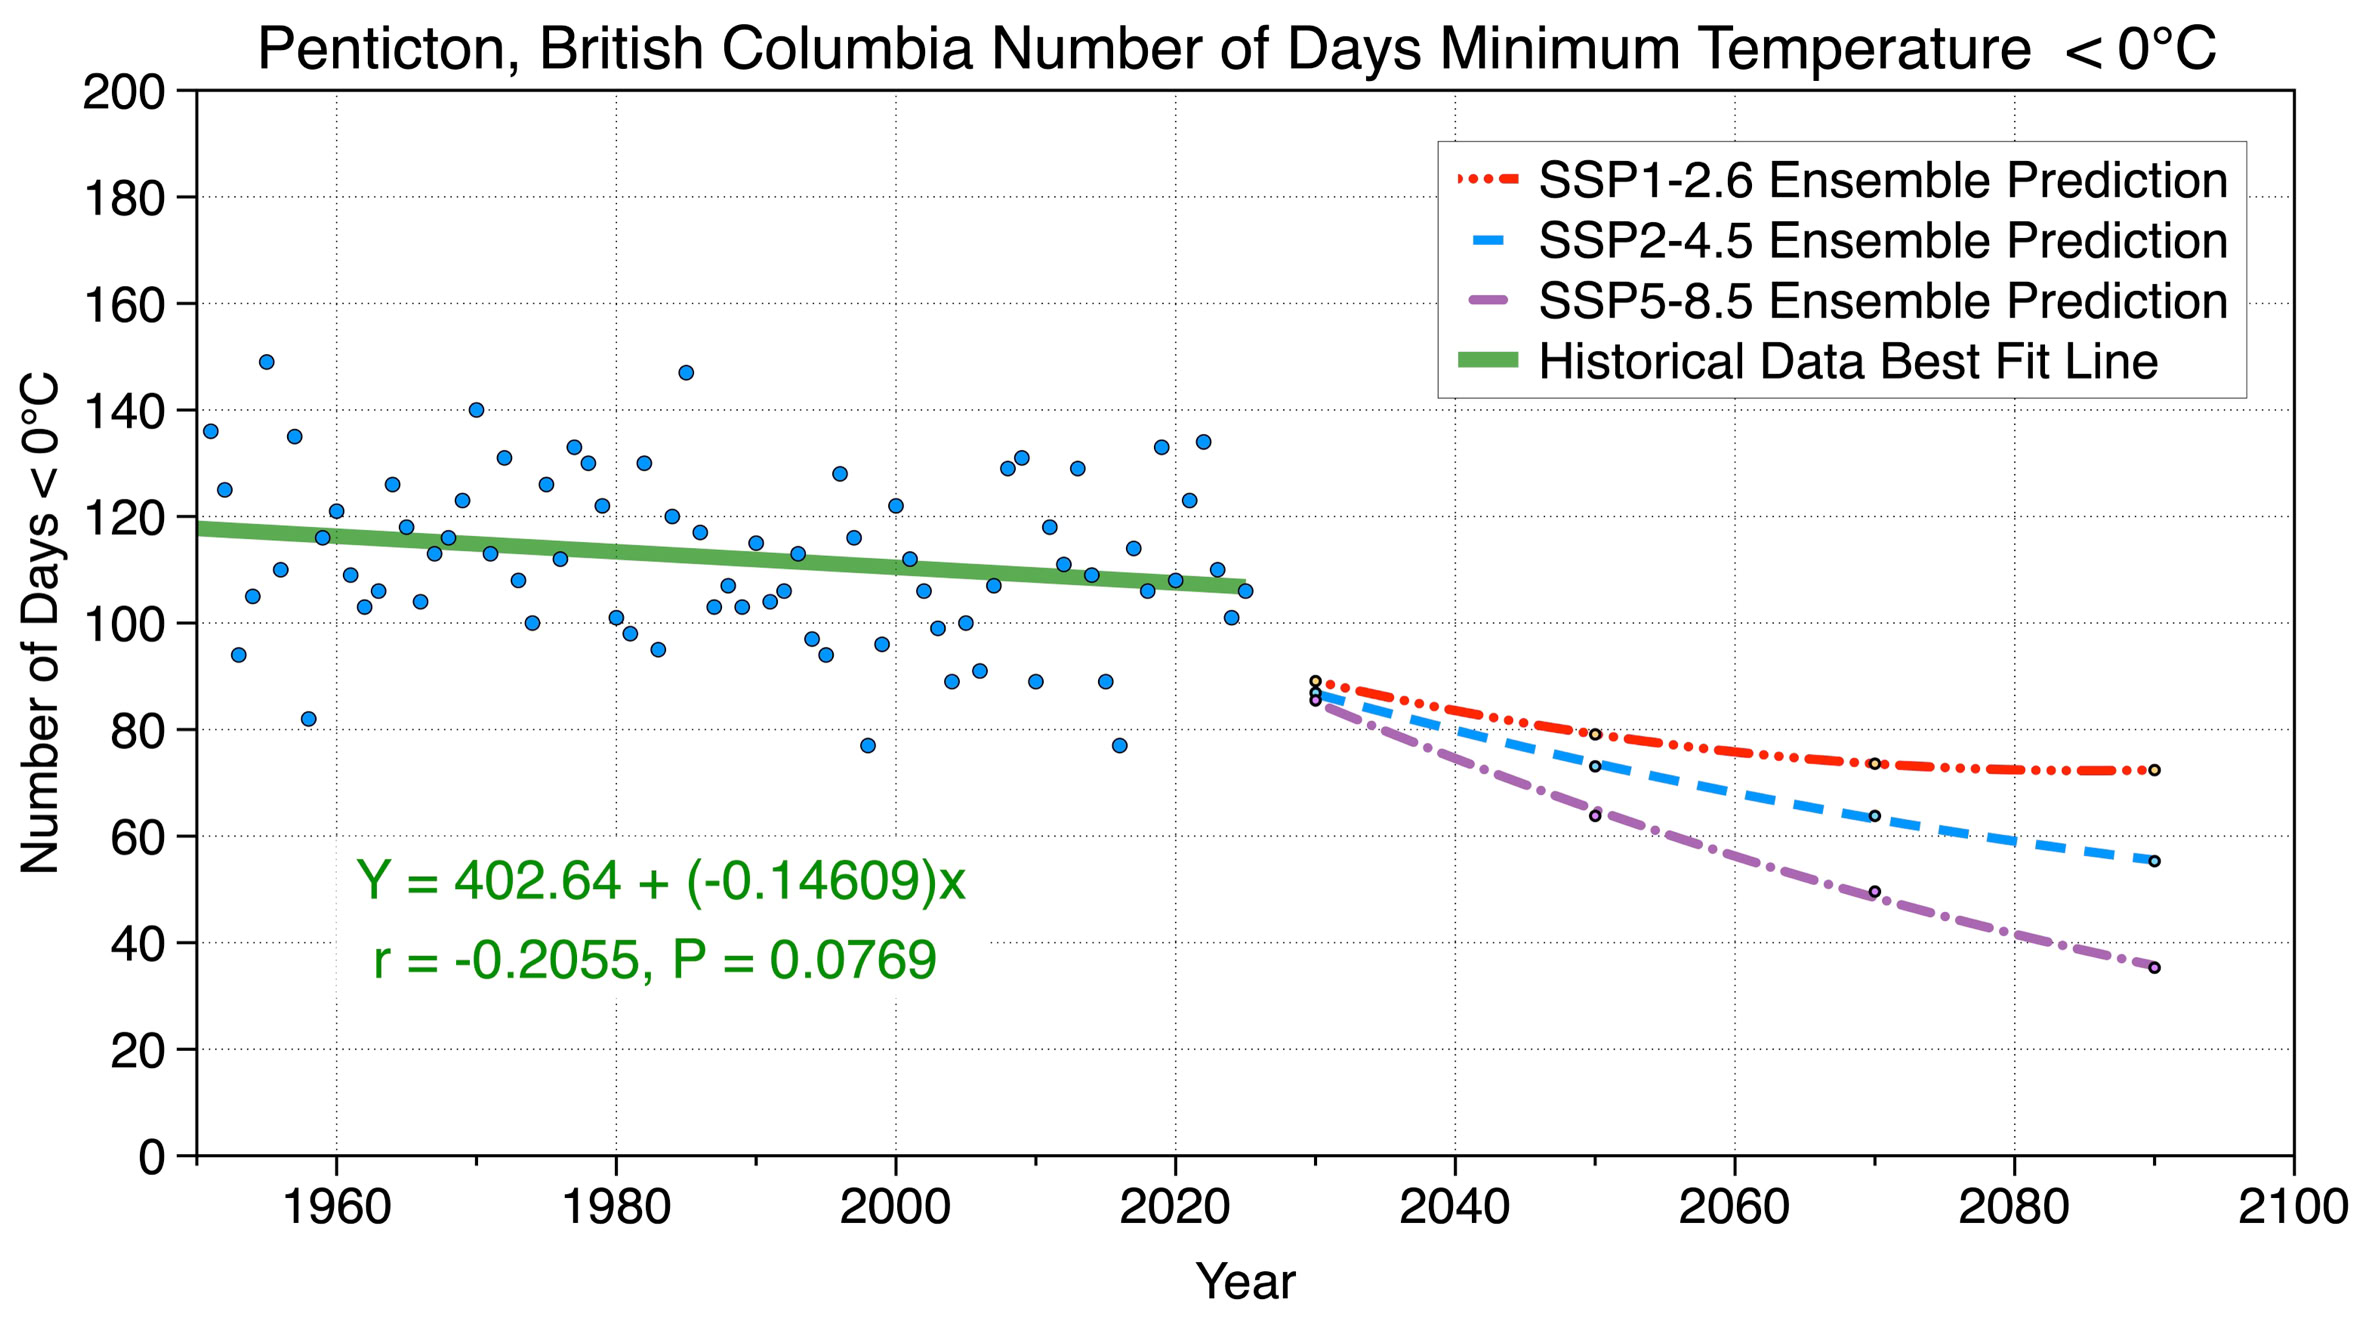
Figure 10 Eight-model ensemble forecasted changes in Penticton’s annual number of days with a minimum temperature less than (<) 0°C under SSP1-2.6, SSP2-4.5, and SSP5-8.5 emission scenarios from 2030 to 2090. Also shown is the historical measurements of the annual number of days with a minimum temperature less than (<) 0°C from 1951-2025, and a best-fit linear regression line (green line) describing the average change in this climate variable during this period.
Figure 2 Eight-model ensemble forecasted changes in Penticton’s annual precipitation under SSP1-2.6, SSP2-4.5, and SSP5-8.5 emission scenarios from 2030 to 2090. Also shown is the historical measurements of annual precipitation from 1951 to 2025, and a line (orange colored) describing the average annual precipitation (319 mm) for the historical years plotted on the graph.
Copyright © 2026 Michael Pidwirny