Human Enhancement of the Greenhouse Effect
Figure 4 Estimated carbon dioxide, methane, and nitrous oxide annual emissions and atmospheric concentrations for the period 2015 to 2100 according to five different Shared Socioeconomic Pathways emission scenarios used in the 6th IPCC Assessment Reports. Image Copyright: Michael Pidwirny. Data Source: SSP Database Website - https://ssp.apps.ece.iiasa.ac.at/.
The chemical nature of the atmosphere is an essential factor in determining the Earth's climate. Heat energy from the Sun is trapped in the Earth's lower atmosphere by a natural process called the greenhouse effect. The quantity of heat trapped depends primarily on the concentrations of various greenhouse gases, such as carbon dioxide, water vapor, ozone, methane, and nitrous oxide. The two greenhouse gases with the largest concentration in the troposphere are carbon dioxide and water vapor. Over the past 160,000 years, estimated levels of water vapor in the lower atmosphere have remained relatively constant, while carbon dioxide levels have fluctuated in sync with the warming and cooling of the Earth.
Starting about 300 years ago, humans began significantly altering the concentration of carbon dioxide in the atmosphere. Measurements indicate that from that time (about 1700) to today, carbon dioxide (CO2) increased in concentration by about 53% (Figure 1). Much of this increase was driven by human activities, including burning fossil fuels, converting natural habitats into agricultural fields, and deforestation. By 2050, scientists predict atmospheric carbon dioxide levels may increase by about 100% from pre-industrial levels. This increase will occur because of the continued human participation in activities that release the greenhouse gases carbon dioxide (CO2), methane (CH4), and nitrous oxide (N2O) into the atmosphere.
Before 1700, atmospheric carbon dioxide levels were about 280 ppm (parts per million). The concentration of carbon dioxide is now (December 2025) about 427.5 ppm (Figure 1) as measured at Mauna Loa, Hawaii. This increase in carboas measured at Mauna Loa, Hawaii. This increase in atmospheric carbon dioxide is primarily due to human activities. Societal changes caused by the Industrial Revolution increased the amount of carbon dioxide entering the atmosphere. Emissions from the combustion of fossil fuels account for about 65% of the additional carbon dioxide found in the atmosphere. The remaining 35% is derived from deforestation and the conversion of prairie, woodland, and forested ecosystems primarily into less productive agricultural systems. Natural ecosystems can store 20 to 100 times more carbon dioxide per unit area than agricultural systems. Both deforestation and natural land-use change reduce the amount of standing plant mass or biomass found on the Earth’s surface. This reduction causes a net export of carbon stored in biomass into the atmosphere through the processes of decomposition and burning.
Since 1750, the atmospheric concentration of the greenhouse gas methane (CH4) has increased by more than 150% (Figure 2). The primary sources for the additional methane added to the atmosphere (in order of importance) are rice cultivation, domestic grazing animals, termites, landfills, oil and gas extraction, and coal mining. The anaerobic conditions associated with rice paddy flooding result in the formation of methane gas (Figure 5.4). An accurate estimate of how much methane is produced from rice paddies has been difficult to determine. More than 60% of all rice paddies are found in India and China, where scientific data concerning emission rates are hard to obtain. Nevertheless, scientists believe that rice paddies make a significant contribution because this type of crop production has more than doubled since 1950. Grazing animals release methane into the environment as a result of herbaceous digestion. Some researchers believe the addition of methane from this source has more than quadrupled over the last century. Termites also release methane through the digestion of plant material. Land-use change in the tropics, driven by deforestation, ranching, and farming, may be causing termite numbers to increase. These types of land conversion produce an environment favorable for termites. Landfills produce methane as organic wastes decompose. Coal, oil, and natural gas deposits release methane into the atmosphere when these deposits are excavated or drilled.
The average atmospheric nitrous oxide (N2O) concentration is now increasing at 0.2 to 0.3% per year (Figure 3). Nitrous oxide is another greenhouse gas. Its contribution to the greenhouse effect is minor relative to the other greenhouse gases already discussed. Nitrous oxide also contributes to the artificial fertilization of ecosystems. In extreme cases, this fertilization can lead to the death of forests, eutrophication of aquatic habitats, and species die-offs. Sources for the increase of nitrous oxide in the atmosphere include land-use conversion, fossil fuel combustion, biomass burning, and soil fertilization. Most of the nitrous oxide added to the atmosphere each year comes from deforestation and the conversion of forest, savanna, and grassland ecosystems into agricultural fields and rangelands. Both processes reduce the amount of nitrogen stored in living vegetation and soil by decomposing organic matter. Nitrous oxide is also released into the atmosphere when fossil fuels and biomass are burned. Using nitrate and ammonium fertilizers to enhance plant growth is another important source of nitrous oxide. How much is released from this process has been challenging to quantify. Some estimates suggest that fertilizers may account for as much as 50% of the nitrous oxide emitted into the atmosphere annually.
The most recent Intergovernmental Panel on Climate Change 6th Assessment Reports uses a variety of future greenhouse gas emission scenarios to model future climate conditions on our planet. These scenarios, called Shared Socioeconomic Pathways, are based on logical assumptions of how future human population growth and socioeconomic development will unfold during the 21st century. The general socioeconomic characteristics associated with each of these scenarios are described in Table 1.
Many scientists believe the SSP2-4.5 scenario is the most likely outcome with reasonable future efforts in climate change mitigation by the various nations of our planet. SSP5-8.5 represents what would happen if very little mitigation took place in the future to tackle climate change. Figure 4 describes the major greenhouse gases, carbon dioxide, methane, and nitrous oxide emission estimates and the resulting change in the concentration of these gases in the atmosphere between 2015 and 2100 under the five Shared Socioeconomic Pathway emission scenarios (SSP1-2.6, SSP2-4.5, SSP3-7.0, SSP4-6.0, and SSP5-8.5).
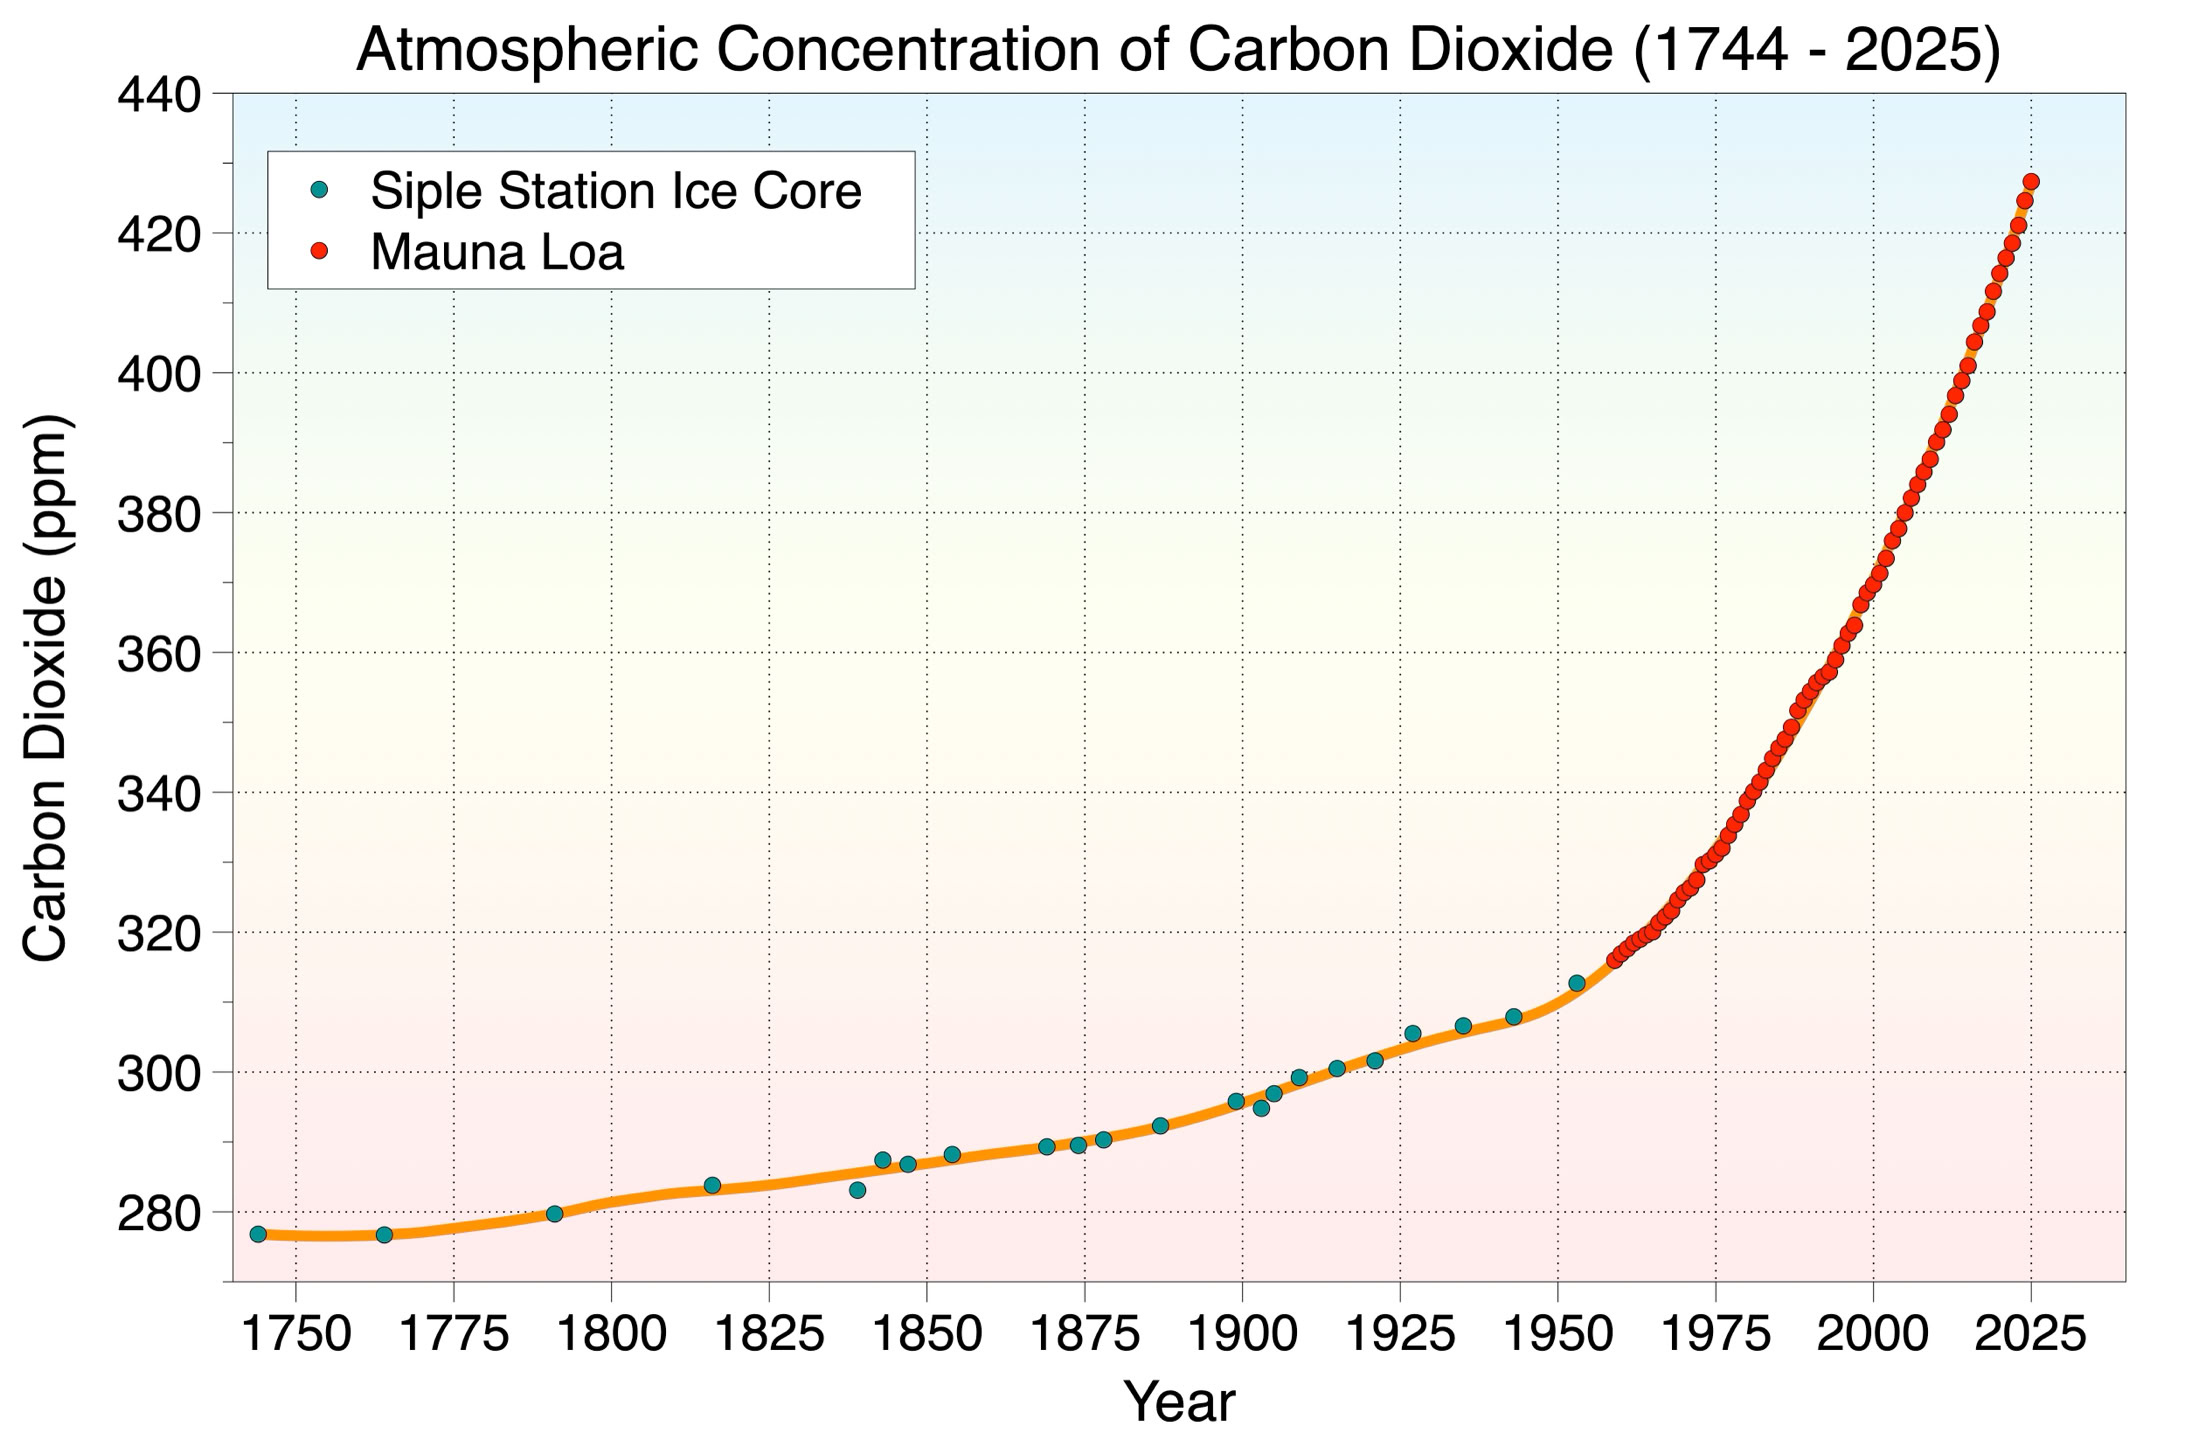
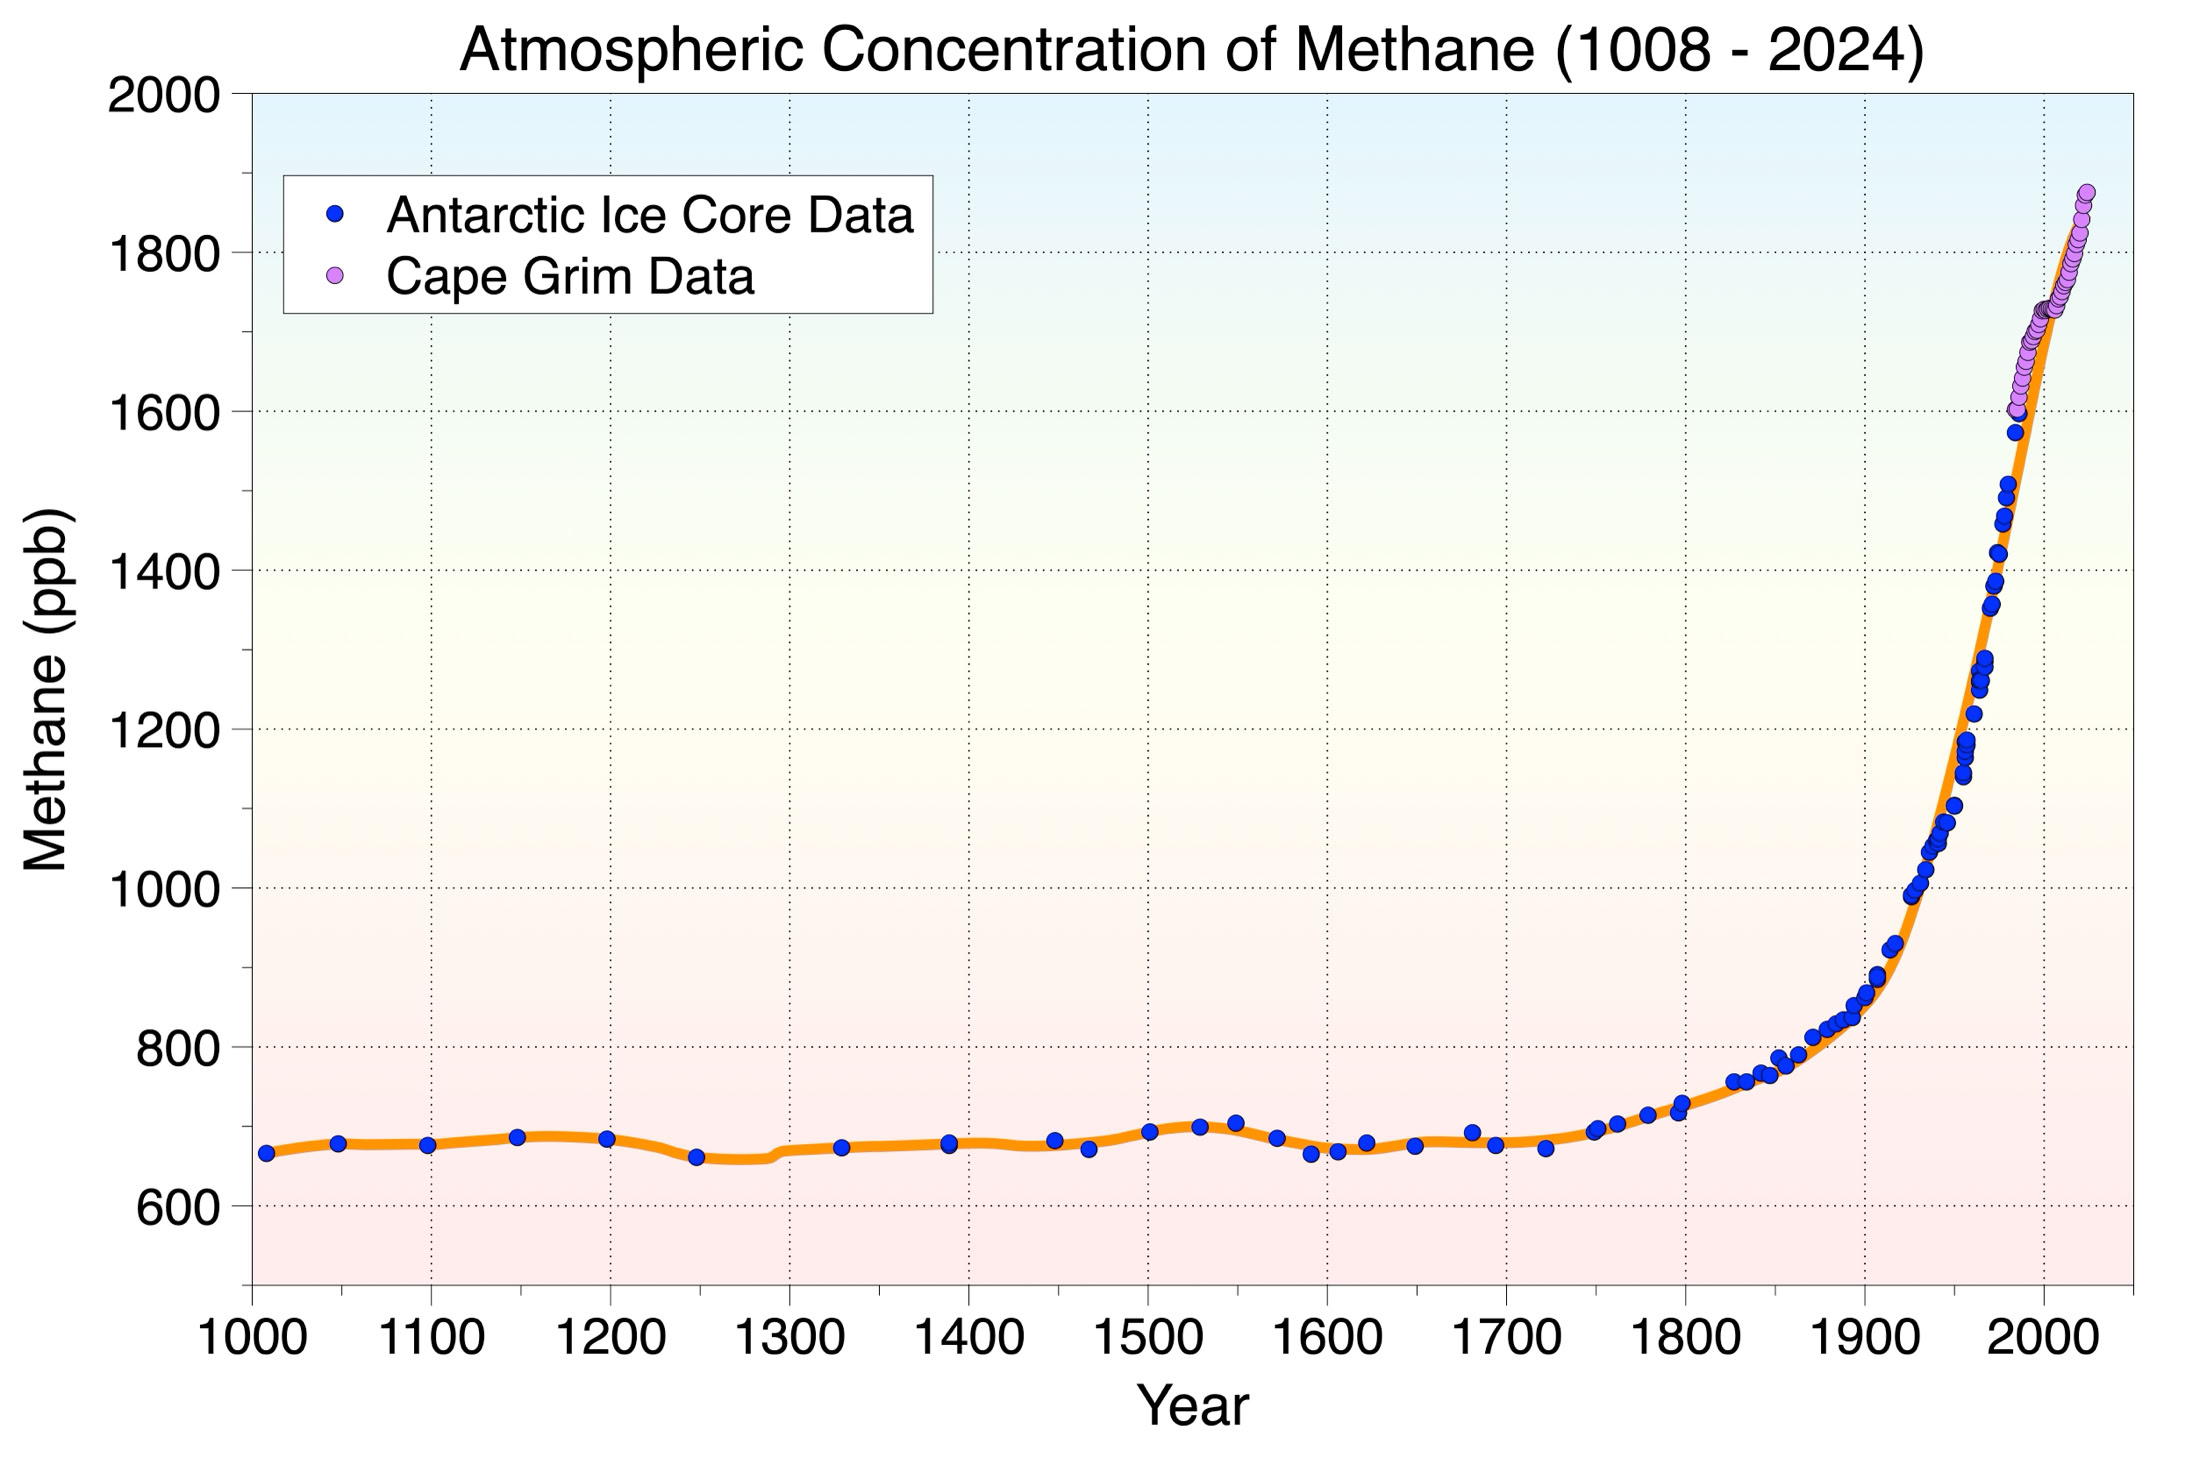
Figure 2 The following graph illustrates the rise in atmospheric methane from 1008 to 2024. Note that the increase in atmospheric methane concentration is exponential. An extrapolation into the immediate future would suggest continued annual increases. Image Copyright: Michael Pidwirny. Data Source: D.M. Etheridge, L.P. Steele, R.J. Francey, and R.L. Langenfelds. 2002. Historical CH4 Records Since About 1000 A.D. From Ice Core Data. In Trends: A Compendium of Data on Global Change. Carbon Dioxide Information Analysis Center, Oak Ridge National Laboratory, U.S. Department of Energy, Oak Ridge, Tenn., USA. and NOAA Earth System Research Laboratory, Trends in Atmospheric Methane, http://www.esrl.noaa.gov/gmd/ccgg/trends_ch4/.

Table 1 General socioeconomic characteristics associated with the five Shared Socioeconomic Pathways (SSPs). Source: Microsoft Copilot AI.


Figure 1 The following graph illustrates the rise in atmospheric carbon dioxide from 1744 to 2025 as measured from the Siple Station, Antarctica, and Mauna Loa, Hawaii. Note that the increase in atmospheric carbon dioxide concentration is exponential. An extrapolation into the immediate future would suggest continued annual increases. Image Copyright: Michael Pidwirny. Data Source: Neftel, A., et al. 1994. Historical carbon dioxide record from the Siple Station ice core. pp. 11-14. In T.A. Boden, D.P. Kaiser, R.J. Sepanski, and F.W. Stoss (eds.) Trends'93: A Compendium of Data on Global Change. ORNL/CDIAC-65. Carbon Dioxide Information Analysis Center, Oak Ridge National Laboratory, Oak Ridge, Tenn., USA and Dr. Pieter Tans, NOAA/ESRL (http:// www.esrl.noaa.gov/gmd/ccgg/trends/) and Dr. Ralph Keeling, Scripps Institution of Oceanography (http://scrippsco2.ucsd.edu/).
Figure 3 The following graph illustrates the rise in atmospheric nitrous oxide from 1978 to 2024. This increase is almost linear. An extrapolation into the immediate future would suggest continued annual increases. Image Copyright: Michael Pidwirny. Data Source: National Oceanic and Atmospheric Administration's (NOAA) Climate Monitoring and Diagnostics Laboratory, http://www.esrl.noaa.gov/gmd/hats/combined/N2O.html.
Copyright © 2026 Michael Pidwirny